
Water The Facts

Domestic Water Usage

|
This graph shows the amount of water used domestically in Los Angeles, CA over the past 20 years. This graph was created using data for the population of Los Angeles County as well as the average amount of water used per person per day. What this graph shows is where the droughts in southern California affected the water usage of the population. There was a large drought during 2001-2002 as well as during the present times, which causes the average water usage to drop significantly.
1 billion gallons of water is approximately equivalent to 133,680,556 cubic feet. To put this in perspective, this is about the size of 4 empire state buildings, and this is just the water used for domestic purposes, such as household water. This volume was calculated by using the geometric formula, which is length * width * height, and converting the gallon to cubic feet. |
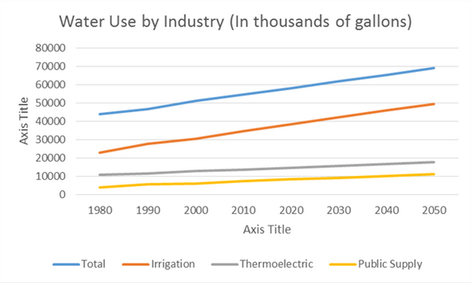
Water Use by Industry
|
This graph shows the amount of water used by each industry in California over a period of 70 years. This graph was created using data from the US government on water usage per industry. What this graph shows is how several industries (irrigation, thermoelectric, public supply) grow and require more water as time goes on. Using the data from the years of 1980 to 2010, a line of best fit for each industry was created in order to project for each to the year of 2050.
Each industry in the graph combine to form 87% of the total water usage of California. The Public Supply makes up 10% of the total; Thermoelectric makes up 25%, and Irrigation makes up the other 52%. With this information, the ratio of total water used to irrigation to thermoelectric to public supply is about 10 : 5 : 3 : 1. |